Synthesizing Light & Sound: Building High-Fidelity Audio Visualizers
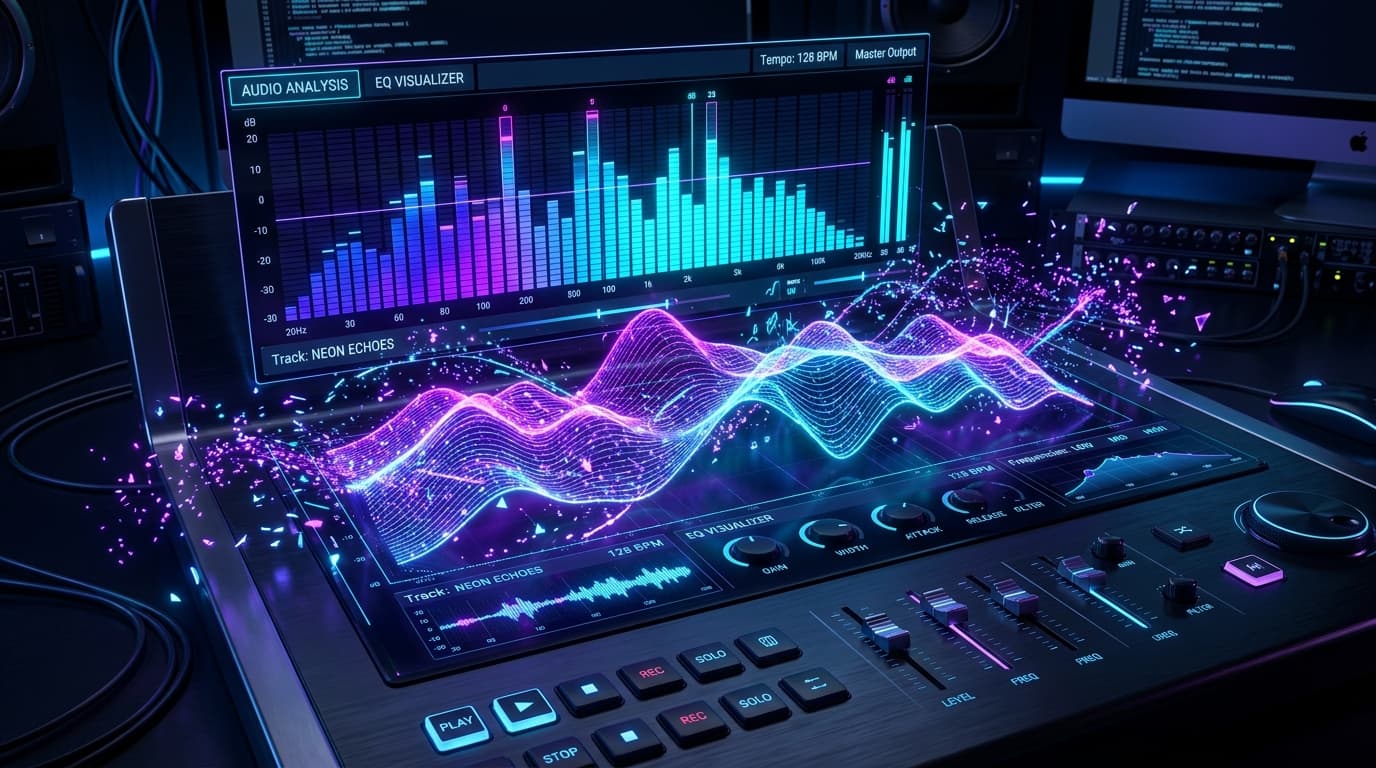
There is something hypnotic about seeing sound. In the physical world, we have analog oscilloscopes and VU meters. In the browser, we can leverage the Web Audio API and modern rendering contexts (like 2D Canvas or WebGL) to build immersive, real-time audio visualizers.
In this technical post, we'll walk through setting up an audio analysis node and rendering a reactive frequency visualizer.
1. Initializing the Web Audio API
To analyze audio, we need to route our sound source through an AnalyserNode. This node acts as a real-time Fourier transformer, breaking down the complex audio signal into its constituent frequencies (bass, mids, treble).
// Step 1: Create Audio Context
const audioContext = new (window.AudioContext || window.webkitAudioContext)();

// Step 2: Create Analyser Node
const analyser = audioContext.createAnalyser();
analyser.fftSize = 256; // Defines frequency bin count (128 bins)

// Step 3: Connect your audio element source
const audio = document.getElementById('my-audio');
const source = audioContext.createMediaElementSource(audio);

source.connect(analyser);
analyser.connect(audioContext.destination); // Route back to speakers
2. Capturing the Frequency Data
Once the node is wired up, we extract the audio data using two main methods:
getByteFrequencyData: Returns frequency amplitude (decibels) for each frequency band. Good for standard spectrum bars.getByteTimeDomainData: Returns waveform shape. Great for retro oscilloscope lines.
const bufferLength = analyser.frequencyBinCount;
const dataArray = new Uint8Array(bufferLength);

function capture() {
  analyser.getByteFrequencyData(dataArray);
  // dataArray now contains numbers from 0 (quiet) to 255 (loud) representing frequency bands
}
3. Rendering to Canvas
Now that we have the frequency amplitudes, we draw them onto an HTML5 <canvas> using a requestAnimationFrame render loop. By creating gradients and modifying coordinates dynamically, we can build a responsive visualization.
const canvas = document.getElementById('visualizer');
const ctx = canvas.getContext('2d');

function draw() {
  requestAnimationFrame(draw);

  analyser.getByteFrequencyData(dataArray);

  // Clear the canvas with a transparent trail to create motion blur
  ctx.fillStyle = 'rgba(0, 0, 0, 0.2)';
  ctx.fillRect(0, 0, canvas.width, canvas.height);

  const barWidth = (canvas.width / bufferLength) * 1.5;
  let barHeight;
  let x = 0;

  for(let i = 0; i < bufferLength; i++) {
    barHeight = dataArray[i];

    // Create a dynamic color mix based on frequency
    const r = barHeight + (25 * (i/bufferLength));
    const g = 250 * (i/bufferLength);
    const b = 50;

    ctx.fillStyle = `rgb(${r},${g},${b})`;
    ctx.fillRect(x, canvas.height - barHeight, barWidth - 1, barHeight);

    x += barWidth;
  }
}
4. Going Beyond: WebGL & Shaders
For high-performance rendering or complex particles, 2D Canvas can run out of juice. That is where WebGL shines. By passing the frequency dataArray into a shader as a 1D texture, you can write GPU-accelerated fragment shaders that morph coordinates, colors, and noise fields based on sound frequencies.
This portfolio uses custom GPU-accelerated particles that respond to track energy—mapping bass amplitudes to particle speed and treble to dispersion.
Conclusion
Building interactive visual media transforms a simple playback interface into an engaging experience. With Web Audio, Canvas, and WebGL, the browser is a powerful canvas for creative coders.
Go plug in your headphones, start analyzing some audio waves, and paint with light!